Project · energy markets
Hormuz Tracker
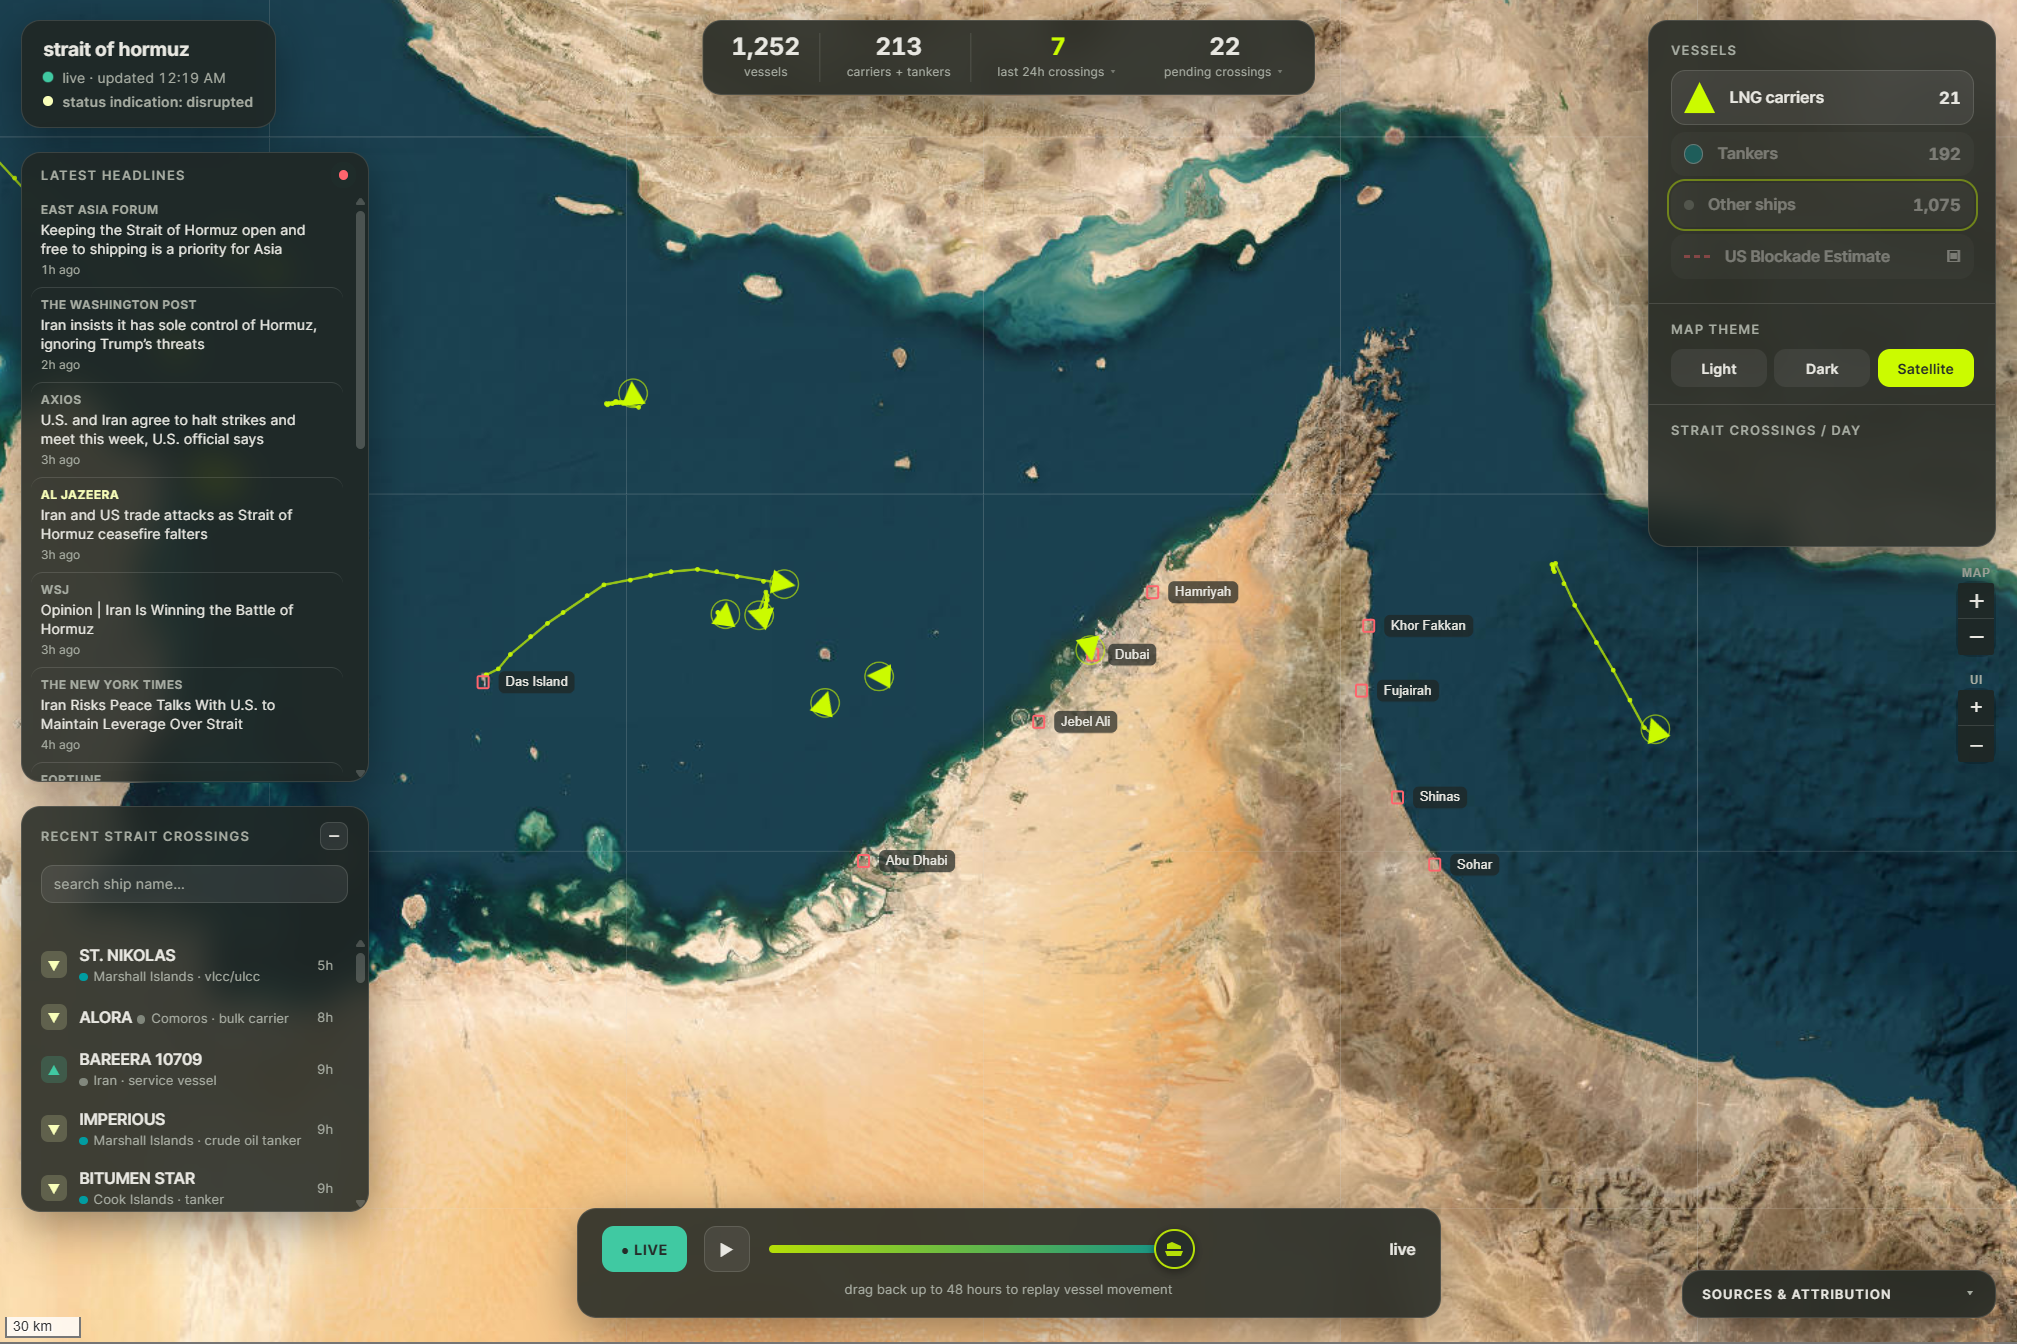
A live map of ship traffic through the Strait of Hormuz, covering the Persian Gulf and Gulf of Oman. It infers tanker and LNG trade disruption and surfaces it as one strait-status signal.
The insight
When one ship could move a market
Through the spring and summer of 2026, Iran and the United States slid into open confrontation, an escalation many analysts struggled to tie to any clear war aim.1 With no obvious path to a decisive victory, the Strait of Hormuz became the pivot of the whole conflict, and the United States reached again for a familiar argument about keeping the world's fuel routes open, not for the first time in its history.2
For a stretch of the crisis, UK wholesale gas could swing violently on whether a single cargo cleared the strait. The threat of closure alone was enough: on 13 April 2026 the benchmark jumped 11.7% in one session, and front-month gas later peaked near 151 pence a therm.3 As the conflict settled into a grind and the market priced the risk in, that sensitivity faded. By late May prices had fallen back toward 96 pence, and the June reopening eased them further.4 The strait stayed a focal point for political argument long after it stopped moving the market.
What I built
A live tracker of around 1,300 ships across the Persian Gulf and Gulf of Oman. It ingests AIS positions, classifies each ship by type, and watches the tanker and LNG segment specifically. From that it derives a single strait-status signal: a plain read on whether energy trade is flowing or under stress.
Notes & sources
- The 2026 Iran-US confrontation and how the strait became its pivot. 2026 Strait of Hormuz crisis, overview; UK Parliament research briefing CBP-10636. ↩
- US precedent for using force to keep Gulf fuel routes open: the Carter Doctrine (1980); the 1984-88 Tanker War; and Operation Earnest Will (1987-88), when the US Navy reflagged and escorted Kuwaiti tankers through the Gulf. ↩
- UK NBP gas rose 11.7% in one session on 13 April 2026, to 122.5p per therm, after a formal warning the strait could close "indefinitely"; the benchmark later peaked near 151p. FinancialContent, 13 Apr 2026. ↩
- Prices eased to about 96p by late May 2026, the lowest since February, as shipping normalised and Qatari LNG resumed; a US-Iran agreement to reopen the strait was announced on 14 June and signed on 17 June. Trading Economics, UK natural gas; Al Jazeera. ↩
- Daily tanker-transit counts are from IMF PortWatch, "Daily Chokepoints Data" for the Strait of Hormuz (field n_tanker), built on AIS data from the UN Global Platform. Static snapshot, 1 February to 21 June 2026, retrieved 29 June 2026. AIS coverage in the region was degraded during the crisis by GPS jamming and vessels going dark, so counts are a lower bound. ↩